AWS Weather API Project
by L. Mark Coty
Why this project?
I wanted to use the knowledge I gained from studying for the AWS DEA-C01 exam to build a pipeline using data pulled from an API. This gave me the opportunity to gain some hands-on experience with several aspects of data handling in AWS that I did not have.
GitHub repository here. Run the notebook.
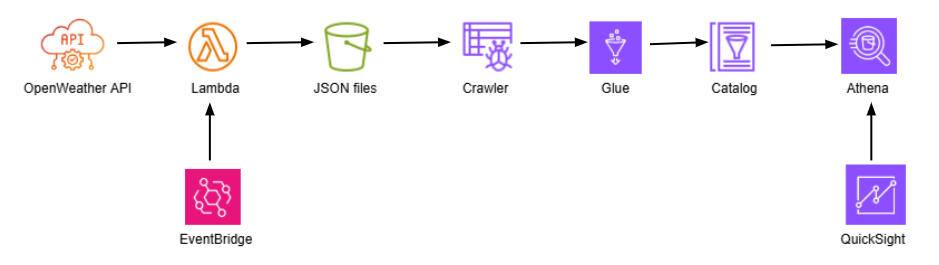
Process:
I subscribed to the OpenWeather API.
I created a Lambda function to pull the 5-day forecast for my zip code, which is updated every 3 hours.
I created an EventBridge rule to trigger the Lambda function every 3 hours.
After 24 hours, I had accumulated a set of JSON files in my S3 data bucket.
I ran a crawler to catalog the data.
I used a Glue job to remove some less interesting or unneeded fields (such as city, country, etc.).
I used Athena to query the final table and to make a few additional tweaks to the data, such as renaming further fields.
I connected QuickSight to Athena and generated several graphs which give a view of the weather forecasts in my area during the relevant period.
Below is a diagram of the pipeline:
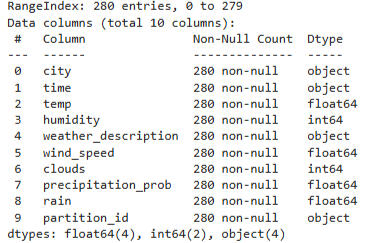
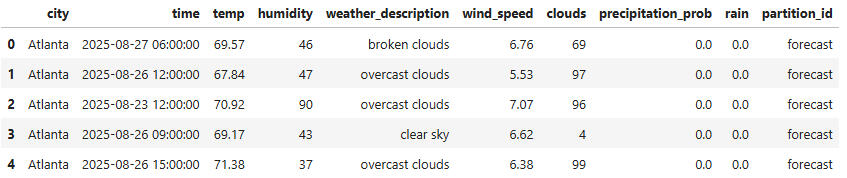
The Content and Nature of the Data:
The data came into the S3 bucket in the form of very heavily nested JSON files, which is apparently typical for weather forecasts. After crawling the files, I used a Glue job to create a well-formatted and usable csv file. One issue was the Rain column, where if no rain was predicted the value was NaN instead of 0, so I changed them to 0. This led to the following characteristics of the dataset:
Next I looked at the boxplots for the numerical columns:
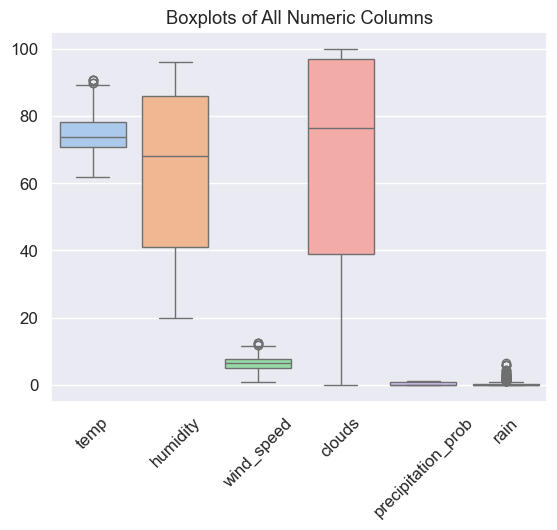
We can see that temps were predicted to stay within a narrow range and that wind and precipitation/rain were not forecasted to be much of a factor. Clouds and humidity seem to be the dominant factors in the forecast for the time period.
Here is a correlation heatmap of the numerical columns:
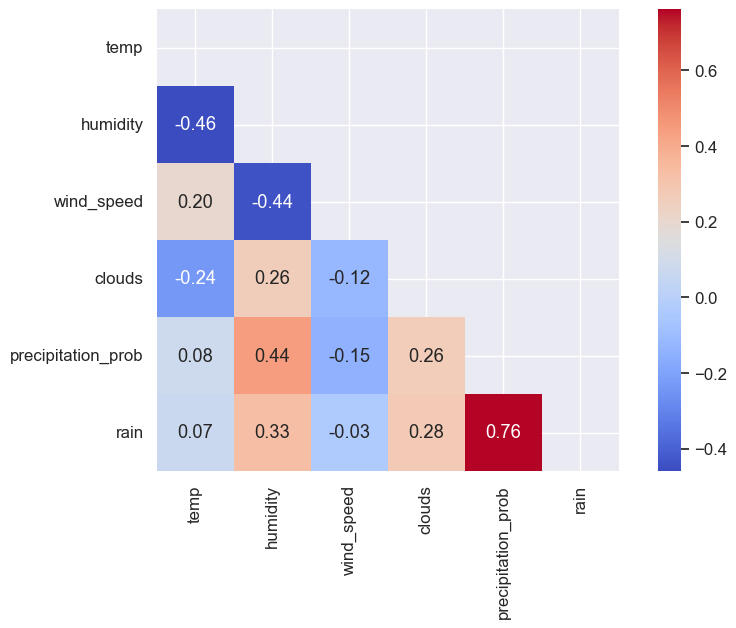
Observations:The negative correlation between humidity/clouds and temperature make sense, since the humid days tend to be cloudy. The strong correlation between rain and precipitation_probablity needs no explanation.
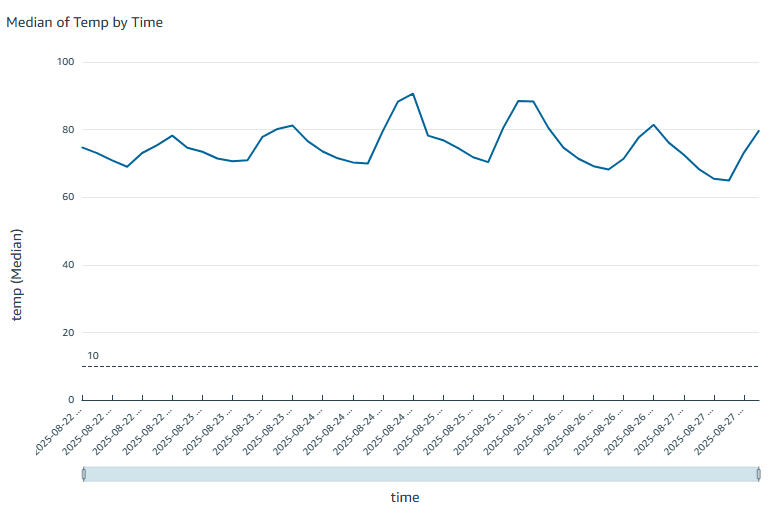
Here is a graph of forecasted temperature over time -- very typical for late August in Atlanta:
And of course, in Atlanta, we must see humidity over time:
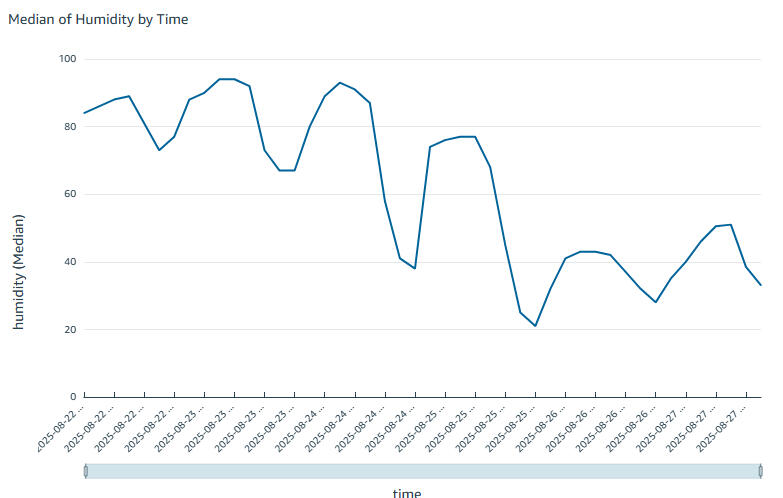
The general downward trend probably indicates the forecasted arrival of a "cold" (i.e., not blisteringly hot) front.
Finally, looking at the sky descriptions, we can see clearly that the sun was predicted to be only occasionally present during this period.
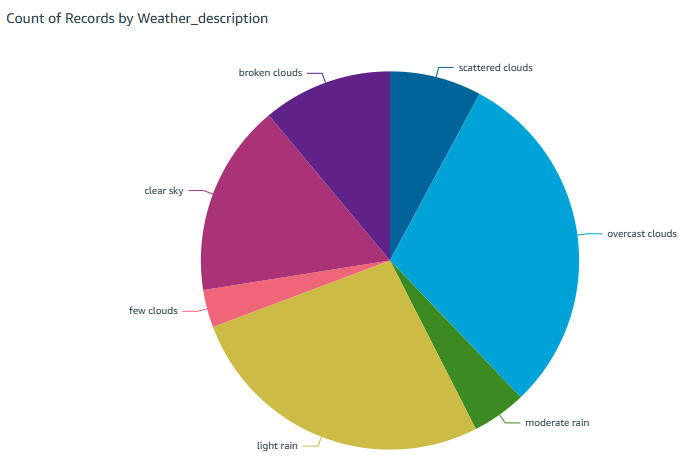
Conclusion:The 5-day outlook didn't change much during the period covered, and clouds and rain are definitely dominant.